Market Analysis & Executive Summary
Institutional Large Deals 🐳
An editorial analysis of recent trading signals, flows, and market-making activities. We break down the complex interactions between derivative open interest and spot market sentiment to give you a clear directional bias. Recent sessions have been characterized by heightened intraday volatility, often driven by algorithmic program trading that exacerbates price swings. Understanding the positioning of these algorithmic participants is crucial, as they often dictate the path of least resistance in the short term. Furthermore, the persistent divergence between various sector indices highlights the highly selective nature of current institutional buying, where stock picking has become paramount over broad index exposure. Editor Summary: 🐳 INSTITUTIONAL DEAL ALERT + AGIIL [BULK] BUY | ₹40.3 Cr | Qty: 1,063,568 @ ₹379.36 Client: ARIHANT CAPITAL MARKETS LIMITED + CERA [BULK] BUY | ₹64.9 Cr | Qty: 118,478 @ ₹5480.0 Client: GOLDMAN SACHS FUNDS - GOLDMAN SACHS INDI + EMSLIMITED [BULK] BUY | ₹18.4 Cr | Qty: 559,752 @ ₹328.02 Client: NK SECURITIES RESEARCH PRIVATE LIMITED + EMSLIMITED [BULK] BUY | ₹10.2 Cr | Qty: 308,448 @ ₹329.4 Client: QE SECURITIES LLP + EMSLIMITED [BULK] BUY | ₹12.8 Cr | Qty: 387,295 @ ₹330.24 Client: MICROCURVES TRADING PRIVATE LIMITED +68 more deals
Large deals flag positioning by informed hands but can be staggered or hedged—use volume, delivery, and follow-up sessions for confirmation.
Large deals flag positioning by informed hands but can be staggered or hedged—use volume, delivery, and follow-up sessions for confirmation. A block deal is not a buy signal; it is a footprint that requires further contextual investigation. Institutional investors often break up large orders to minimize market impact, meaning that a single block deal may be part of a larger accumulation or distribution program. Analyzing the subsequent price action and volume patterns is essential for determining the true intent behind the trade.
Desk Context & Key Signals
Key market instrumentation signals and primary drivers identified today: INSTITUTIONAL, LARGE, DEALS, DEAL, ALERT, AGIIL, BULK, BUY.
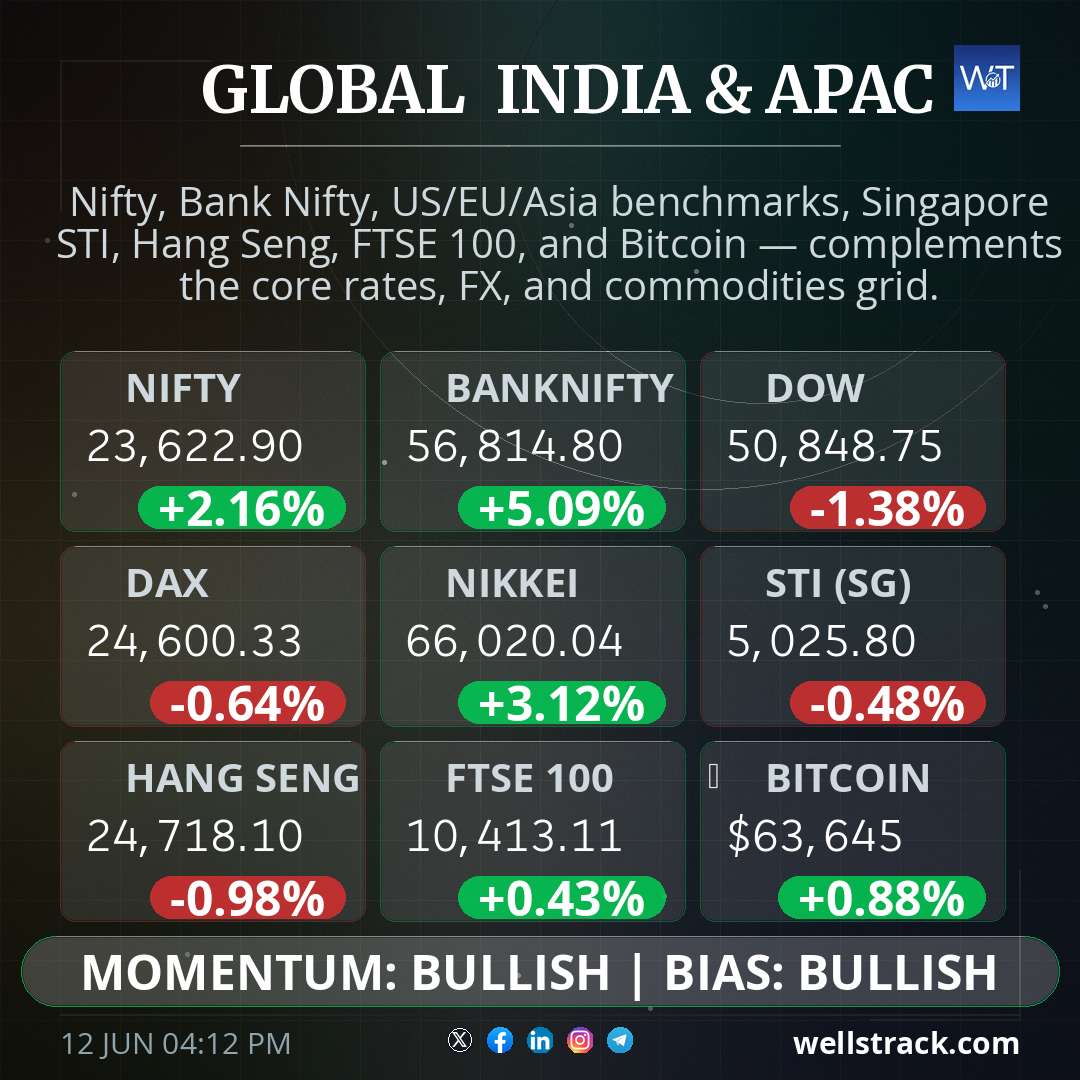
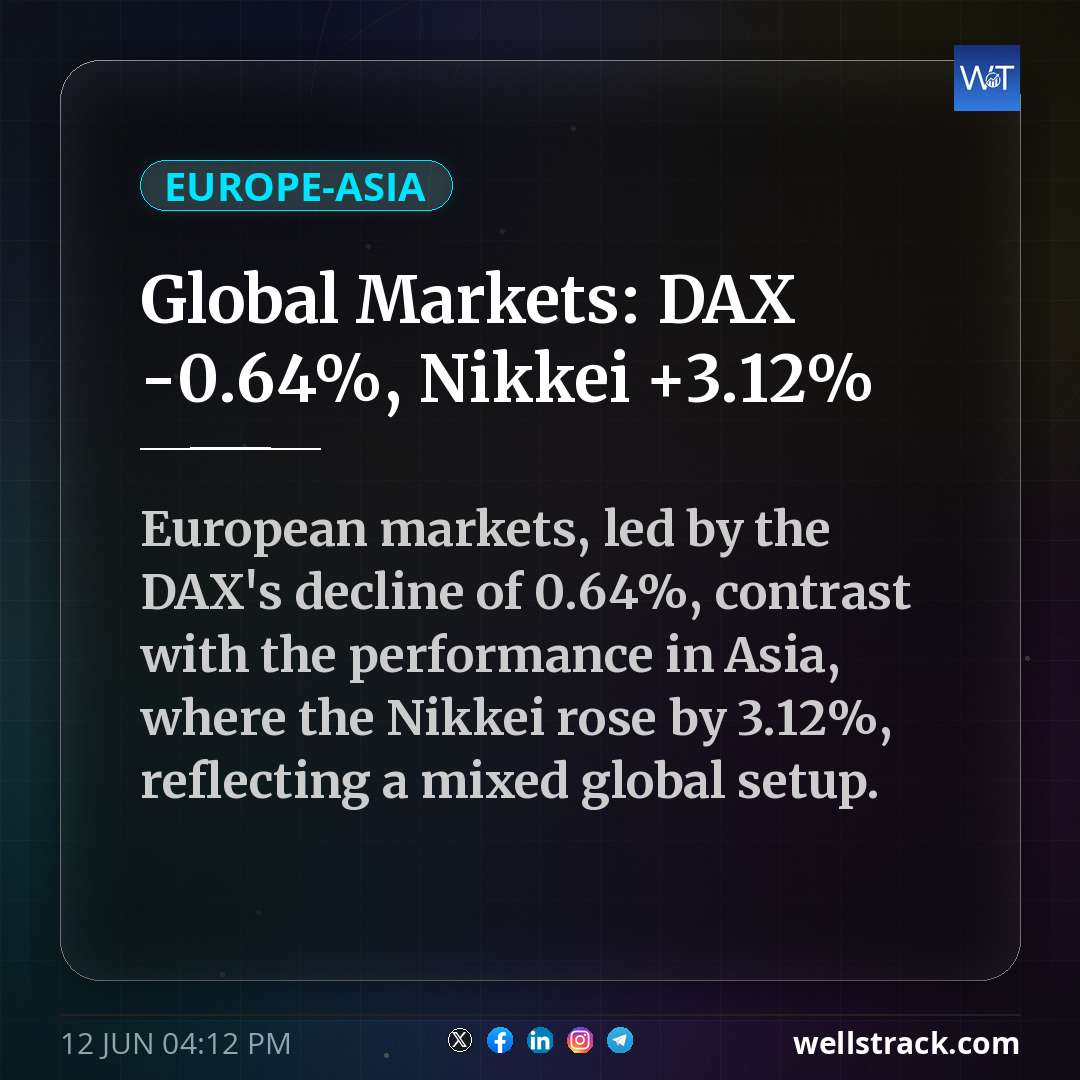
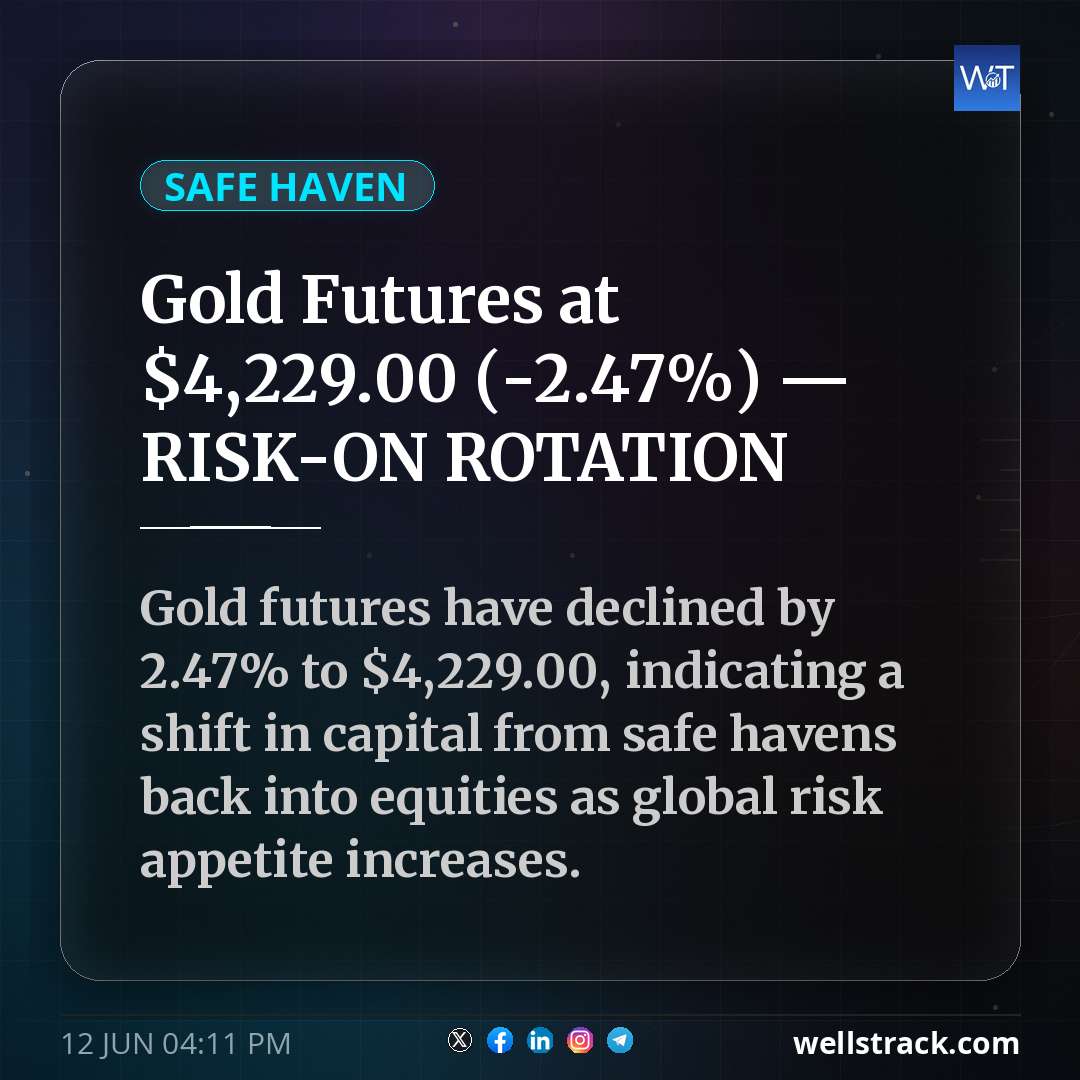
Global yield curves, international dollar strength, and energy benchmarks continue to drive institutional asset allocation in emerging markets. When the US 10-year Treasury yield exhibits pronounced volatility, it inevitably triggers automated algorithmic selling or buying in risk assets globally. We are closely monitoring the DXY (US Dollar Index) for signs of a breakdown or breakout, as this will dictate the direction of foreign portfolio flows. Furthermore, the recent shifts in central bank balance sheets have fundamentally altered the global liquidity landscape, forcing hedge funds to aggressively deleverage or releverage their portfolios in response to changing funding costs. This dynamic is particularly evident in the highly sensitive currency markets, where carry trades are being rapidly unwound or re-established, creating ripple effects across all major asset classes. The interplay between fiscal policy announcements and monetary policy expectations adds another layer of complexity, making the current macroeconomic environment one of the most challenging in recent history.
Institutional sentiment, derived from FII index futures positioning, shows a significant accumulation of short contracts. Unless we see a short-covering rally triggered by an unexpected positive catalyst, the path of least resistance remains to the downside. The positioning of large institutional investors, such as FIIs and mutual funds, is a critical driver of market trends. These entities control massive amounts of capital and their buying or selling activities can have a profound impact on market prices. By tracking their positioning in the futures and options markets, traders can gain valuable insights into their directional bias and anticipate potential market movements.
Technical & Sector Analysis
From a purely technical perspective, the market structure remains complex. Moving average crossovers on the daily timeframe are currently conflicting with momentum oscillators like the RSI and MACD on the hourly charts. This time-frame mismatch often leads to choppy, range-bound price action until a clear catalyst emerges to align the timeframes. The presence of multiple, conflicting technical signals is a hallmark of a transitional market phase, where neither the bulls nor the bears have established clear control. In such environments, traders are best served by adopting a neutral stance and waiting for a decisive breakout or breakdown before committing significant capital. The most reliable technical patterns are often those that develop over longer timeframes, as they are less susceptible to intraday manipulation by high-frequency trading algorithms.
The banking and financial services sector, which carries the heaviest weightage in the benchmark indices, is currently at a critical technical juncture. If the banking heavyweights fail to sustain their current support zones, it will mathematically drag the broader index lower, regardless of the performance in mid-cap and small-cap segments. The health of the banking sector is inextricably linked to the overall health of the economy, as banks are the primary conduits for credit creation and economic activity. A deterioration in asset quality or a slowdown in loan growth can have profound implications for the broader market. Therefore, investors must closely monitor the performance of leading financial institutions, as they often provide early warning signs of systemic stress.
India Read-Across & Domestic Flows
Index futures and high-beta sector ETFs show distinct correlation changes—position sizing remains the primary risk management tool. When the Bank Nifty diverges from the Nifty 50, it is usually a precursor to a broader market reversal. Capital preservation should be prioritized over aggressive scaling. The Bank Nifty, heavily weighted with financial stocks, is extremely sensitive to changes in interest rates and liquidity, making it a reliable leading indicator for the broader market. When the Bank Nifty begins to underperform the Nifty 50, it often signals that institutional investors are adopting a more defensive posture and reducing their exposure to risk assets. Recognizing these subtle shifts in intermarket relationships can provide traders with a significant edge.
What to Watch Next
Follow-through volume on the cash market versus futures-led gaps. If the cash market does not support the initial derivative spike, fade the move.
Whether leaders in the same sector confirm or diverge from the narrative. Broad participation is required for sustainable breakouts.
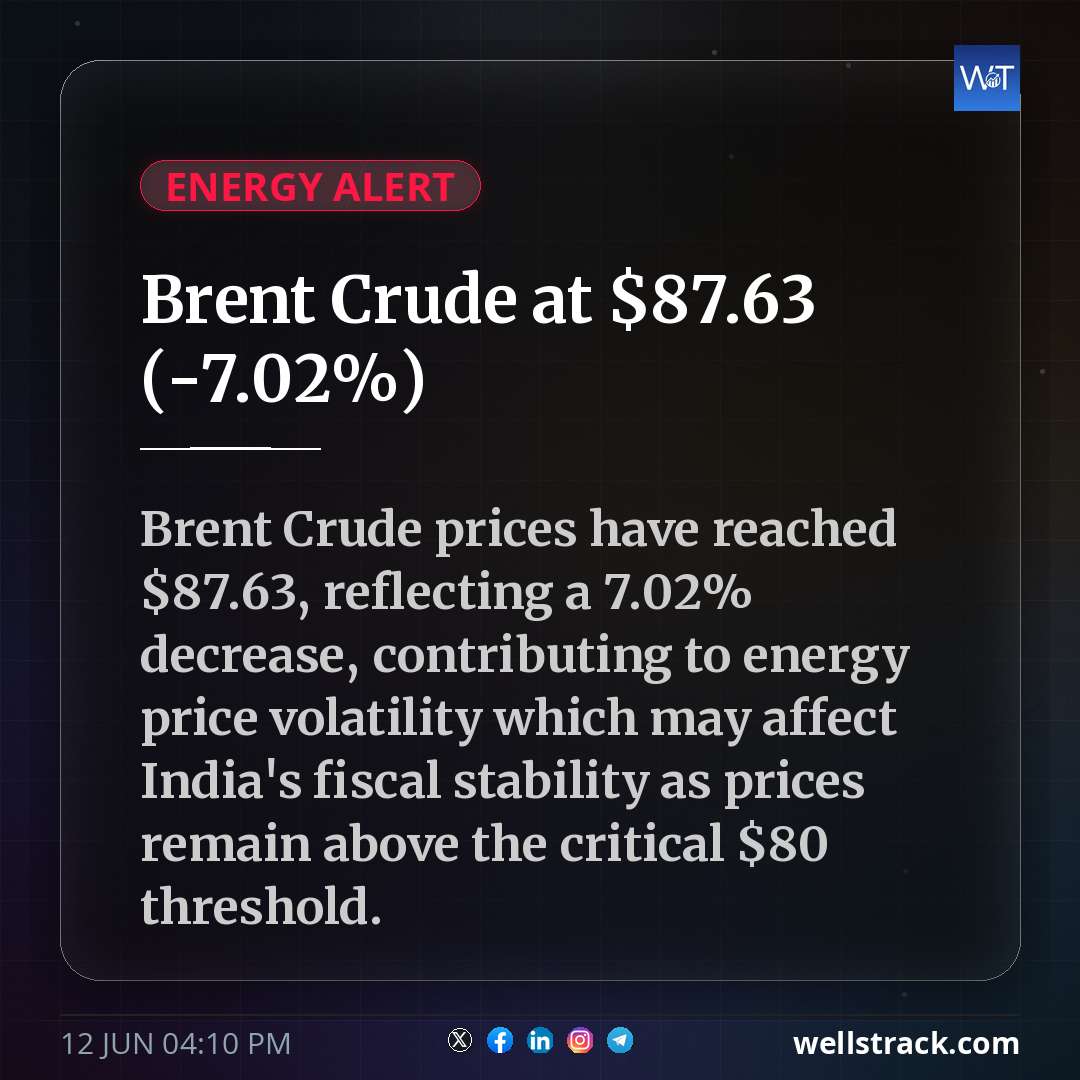
Macro prints (inflation, Fed/RBI guidance, crude) that could reset correlations and invalidate current technical setups entirely.
Risk Disclosure: Trading in equities and derivatives is inherently risky and is not suitable for all investors. The high degree of leverage can work against you as well as for you. Before deciding to trade, carefully consider your investment objectives, level of experience, and risk appetite.
Editorial Methodology: We utilize a hybrid approach combining automated quantitative screening with expert human editorial oversight to distill complex market noise into actionable intelligence.
About WellsTrack: WellsTrack publishes institutional-style market intelligence for Indian and global readers. Articles may be updated dynamically as new verified data from exchange feeds or institutional partners arrives; always verify timestamps when sharing analysis.